February has come and gone. It's hard to believe it is already March 1st. Hopefully, spring is just around the corner.
The first day of the month for me is a day spent charting data and thinking over the previous month. I have a routine that I follow and thought I'd share it. I'm always tweaking my routine, but here is what I am currently doing.
I will start by saying that I LOVE data. I track a lot of data. That doesn't mean you have to track everything I mention, but I do suggest taking a look at your numbers. I don't suggest you track numbers you aren't going to look at just to be tracking something.
So what do I track?
✎ Amount earned daily/weekly/monthly/quarterly/yearly
✎ Average $ Earned Daily/Monthly
✎ Average Number of Products Sold Daily/Monthly
✎ Number of TPT Followers/Votes/Overall Rank/State Rank
✎ Number of Followers on my blog, FB, IG, Google+, each Pinterest board I have for TPT
✎ Number of Products
✎ Number of Each Product Sold Each Month
✎ Number of New (from that month) Products Sold & Amount Earned
✎ Types of Products Sold Each Month (ex: Activity Packs, Interactive Notebooks, Stations, Trashketball, etc)
✎ Popularity of Skills Each Month (ex: add/subtract decimals, multiply/divide fractions, integers, etc)
✎ Top 5 Products in Earnings for the Month
✎ Top 5 Products in Earnings Overall
✎ Bottom 5 Products in Earnings Overall
✎ Ad/TPT Promos Information
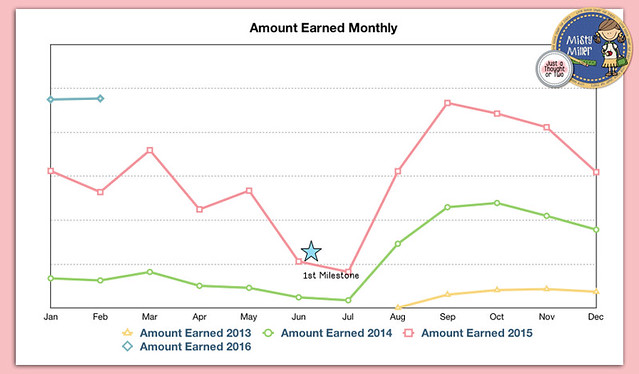
Here's one of my graphs.
Did I mention I LOVE data? Now, I don't track this just to have pretty charts and graphs. I actually spend time looking at this data to see what it might tell me. Some things I've learned:
✿ Recently I decided to look at my Types of Products Sold Each Month and discovered a similar pattern for the percentage of types sold. I have 2 types of products that create 40-50% of my sales each month. That tells me I want to make more of that type of product.
✿ I can compare this February to last February and see what percentage of increase I had.
✿ I know that what I'm doing on Pinterest is helping as I am seeing an increase in followers and hopefully, that is leading to an increase in sales.
✿ I know whether my marketing on FB and TPT promotions are working or not.
✿ I can see what math skills are being sold more in which month.
After I track my data, I do analyze it and think about (and write down) what worked, what didn't, what can be improved on, and what is going fine. Sometimes it's a guessing game since we don't actually know how people land in our store. I also like to write down any ideas floating around in my head.
Now it's time to make plans for the new month. I look at what skills might be selling this month and next, set some realistic goals, and make realistic plans such as:
✔ Number of Products to Create
✔ Number of Blog Posts to Write
✔ FB Ads I want to Schedule & When
✔ I sketch out what products I will be creating each week of the month.
✔ I check to see how many pins I have scheduled and plan to add more so it's filled for the month.
✔ Ideas for blog posts for the month
✔ Revenue goal
I have a monthly calendar to write everything down that is happening for the month (business and personal). I also have a weekly calendar that I plan at the beginning of each week. Things happen and ideas change. I only plan one week at a time, so I can change things as needed. Some weeks I get more accomplished than I planned. Other weeks, I don't get much accomplished and need to push it to the next week.
So that's my monthly data tracking and planning in a nutshell. Track the information you are comfortable with tracking. Make monthly goals and plans to help you focus when you have time to create. If you have any questions, feel free to comment below or contact me via email: littleroomunderthestairs AT gmail DOT com.
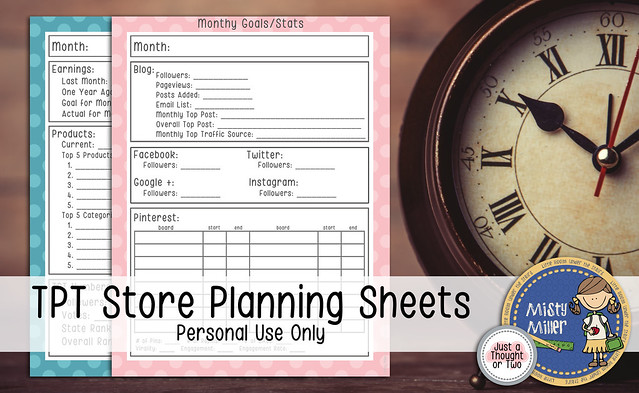
If you would like my Monthly Goals/Stats pages, click here or on the image below.
I do have data tracking spreadsheets uploaded to my TPT store. If you are interested, you can find them here.


